
Product analytics that connects behaviour to business outcomes
Instrumentation, funnels, and experimentation so product decisions follow usage evidence.
Product Analytics — Overview
Product analytics tracks what users do inside your product — not just how many visited a page. It gives product, growth, and engineering teams a shared source of truth for decisions.
Aqeeq designs event taxonomies, instruments products, builds dashboards, and runs analyses that survive scale — from first MVP to millions of events per day.
What product analytics is — and what it is not
Clarity on scope prevents the wrong tooling, the wrong metrics, and dashboards nobody trusts.
Product analytics
Tracks user actions inside your product — signups, feature usage, conversions, and retention — tied to identifiable users or cohorts.
User-level, not aggregate-only
Follow a single user's path, segment by behaviour, and compare cohorts over time.
Event-based, not session-based
Every meaningful action is captured as a discrete event with properties — enabling funnels, paths, and cohort analysis.
Not business intelligence
BI tools aggregate data for reporting. Product analytics focuses on behavioural patterns that drive product decisions.
Not web analytics
Web analytics measures traffic and page views. Product analytics measures what users did once inside the product.
Actionable, not just descriptive
Good product analytics connects behaviour to outcomes — activation, retention, revenue — with analyses teams can act on weekly.
How we set up product analytics: five steps from audit to insight
We do not drop a tracking snippet and disappear. Setup is a structured engagement with documentation your team inherits.
01
Analytics audit
Review existing tracking, data quality, tooling, and gaps against your decision-making needs.
02
Dashboards
Build role-specific dashboards tied to weekly decisions — not vanity charts.
03
Event instrumentation
Design a clean event taxonomy and instrument the product — client and server side as needed.
04
Analysis loop
Run funnel, cohort, and retention analyses; document findings and feed the product backlog.
05
Metrics framework
Define activation, retention, and north-star metrics with clear ownership and targets.
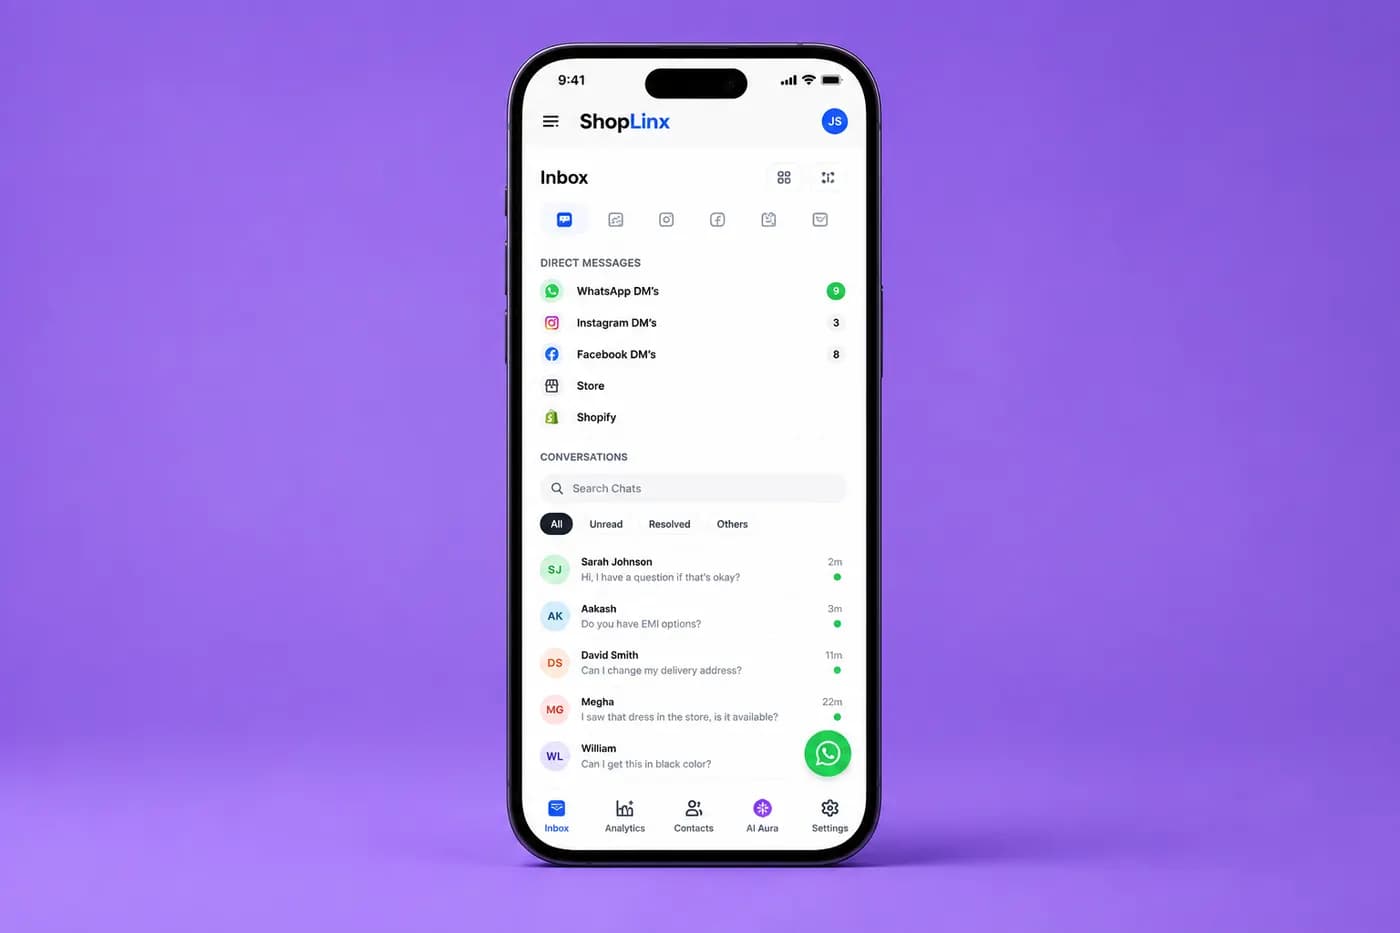
3.2M monthly messages. Commerce that stays up at peak.
WhatsApp turned from a manual inbox into a production sales channel — catalog, cart, payments, and AI support at retail scale.
Read story
Self-serve analytics without opening the BI queue
Governed natural-language access to business data so leaders get answers without waiting on analysts or raw SQL.
Read storyCommon questions about product analytics engagements
From tooling choices to timeline — what teams ask before instrumenting a production product.
Should we build our own analytics stack or use an off-the-shelf tool?+
We recommend based on volume, privacy, team skills, and cost. Often a hybrid works — product analytics for behaviour, warehouse for deep analysis.
Which metrics framework should we use?+
We adapt frameworks (AARRR, HEART, custom) to your business model — defining a small set of metrics leadership reviews weekly.
How long does proper setup take?+
A focused MVP instrumentation can ship in 2–4 weeks. Full taxonomy, dashboards, and analysis loops typically run 6–12 weeks depending on product complexity.
What is the difference between auto-capture and manual event tracking?+
Auto-capture is fast but noisy. Manual events are precise and governance-friendly. We usually combine both with a documented taxonomy.
Move forward with product analytics
Book a conversation — we will scope the engagement or tell you if another path is a better fit.